Debugger
Debugger overview
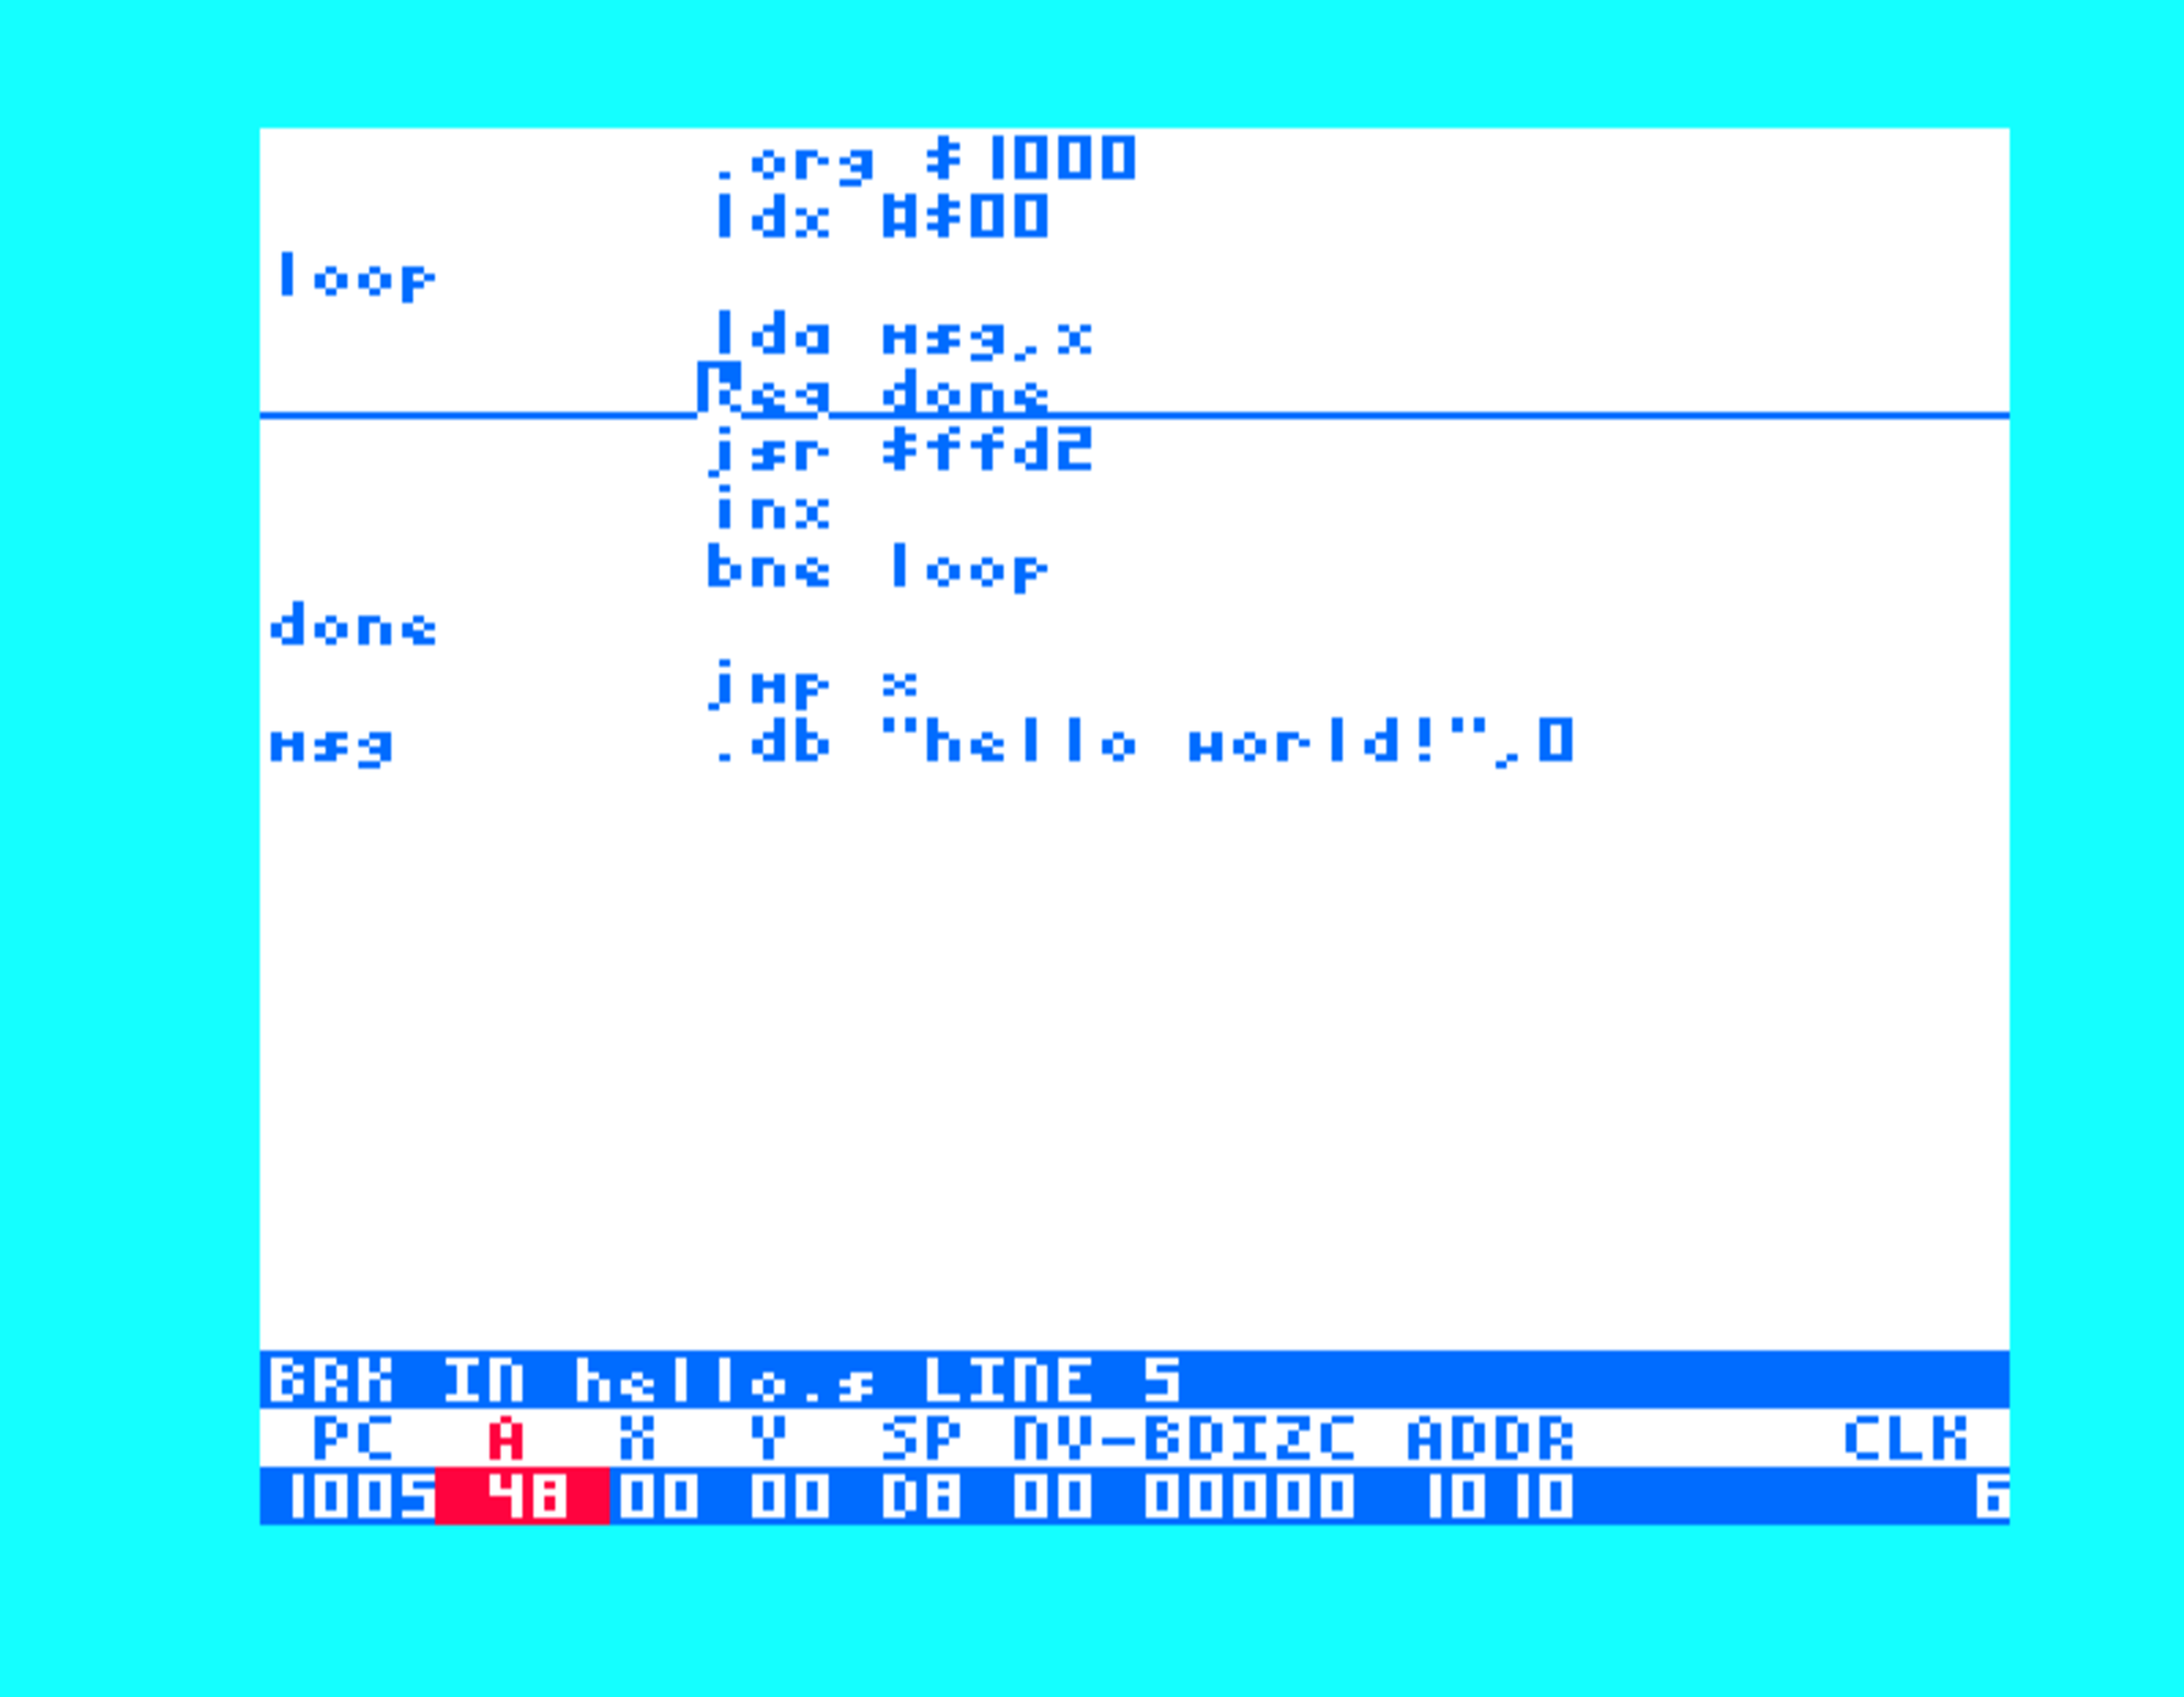
The debugger
The debugger allows you to step through code, set breakpoints, and watch data as you execute your program.
Upon entering the debugger, a view of the system state is displayed at the current step or breakpoint.
This includes the state of the registers (A, X, Y, P, SP, and PC) as well as any effective address that was calculated for reading/writing by the last instruction. Note that if the last instruction executed did not read or write to memory, the effective address field is set to $ffff.
While debugging, most navigation commands work as normal. Breakpoints may be set as they would in the editor prior to assembly, and they will be installed in real time. Other edits are not allowed, however, while the debugger is active.
RAM for both the debugger and the user program is saved/restored when control transfers between the two. That is the screen data ($1000-$2000), the zero page, and color RAM. This allows the debugger and debugged program to operate independently without worrying about writes to one affecting the other.
All debugger commands except for the “GO” command operate on completely virtualized state.
Warning
Do not overwrite the BRK or NMI vectors at $0316–$0319 when using GO.
Monster uses these vectors to handle breakpoints and return to the debugger.
Overwriting them can prevent either operation from working.
The BRK vector is used to return to the debugger when a breakpoint is encountered. If your program has its own idea of how to handle breakpoints, it may overwrite the BRK vector, but the debugger will be unable to handle them as a result.
The NMI vector, similarly, allows you to re-enter the debugger on command with  .
.
Recovery
In the event that you free run your program and it crashes, Monster will attempt to recover the existing state if it can. Upon reset, you will be presented with the option to try recovery or to reinitialize (unless the state was clobbered to such an extent that the “warm” state cannot be detected).
Recovery is not guaranteed to work, but if it does, your open source buffers and previous debugger state will be restored. The state of the program you were debugging upon crash in the expanded memory area ($400-$1000 and $2000-$8000) will also be available for you to debug with the monitor or visual debugger. The internal memory area ($00-$400 and $1000-$2000) will retain its values from when the free-run that crashed the system was initiated.
Debug commands
The following commands are supported by the debugger and are accessed by their respective Key in the table below.
KEY |
NAME |
DESCRIPTION |
|---|---|---|
|
SOURCE VIEW |
maximizes the screen area for viewing the source code |
|
REGISTER EDITOR |
enters the register editor |
|
BREAK VIEW |
displays the breakpoints that have been set and allows them to be enabled/disabled |
|
WATCH VIEW |
displays the watches that have been set (see the Watch Viewer section) |
|
MONITOR |
opens the text-based monitor as a window over the debug view |
|
MEM VIEW |
activates the memory window, which takes control until the user exits it |
|
STEP OVER |
steps to the next instruction. If it is a JSR, continues AFTER the target subroutine |
|
STEP OUT |
steps until the next RTS instruction |
|
STEP |
steps to the next instruction. |
|
TRACE |
like GO but the debugger takes control between each instruction |
|
GO |
continues execution from the current program counter |
|
JUMP TO |
sets the PC to the address corresponding to the line the cursor is on |
|
RESET STOPWATCH |
resets the value of the stopwatch to 0 |
|
QUIT DEBUGGER |
Prompts the user for confirmation then quits the debugger upon receiving it |
|
SOURCE VIEW |
closes every open window and gives the whole screen back to the source view (also available with F1) |
|
SHOW FRAME |
displays the current state of the user program until any key is pressed |
|
GOTO BREAK |
navigates to the address that the debugger is currently paused at |









Register editor
The register editor moves the cursor to the register contents and allows the user to enter
new values for them. Pressing  will confirm the new register values
and update them to those values immediately.
Pressing
will confirm the new register values
and update them to those values immediately.
Pressing  will abort this process and leave the old register values
intact.
will abort this process and leave the old register values
intact.
Stopwatch
Next to the registers, under the CLK label, is a 24-bit counter that displays the
number of cycles executed by the instructions that have been STEP’d into.
Press  +
+  to reset the stopwatch to 0.
Note that the number of cycles is displayed in decimal unlike the rest of the information in the debug view, which is displayed in hexadecimal.
Stepping through code
There are a variety of ways to execute the program that allow us to gather quite a lot of information about the instructions we executed. The debugger also contains a 6502 simulator. This simulator knows what registers an instruction uses/modifies, the effective address that is read/written, and mode.
How does this help us, the user? For example, when an instruction affects a given register, that register is highlighted in the debugger even if the register value hasn’t changed. We can also activate a watch even if we don’t store a new value to it. We can even activate a watch when a value is loaded from the watched address.
The simulator also counts cycles, allowing us to keep track of how many have elapsed since the program began or the stopwatch was reset.
From that cycle count it also derives the position of the electron beam, which
is what the LINE and CYC values in the machine state view report. The VIC’s
raster registers are emulated from the same counter, so a program that reads
$9004 (bits 8-1 of the raster line) or bit 7 of $9003 (bit 0 of the raster
line) sees exactly the LINE that is displayed. The rest of $9003 – the
screen geometry – reads back as the program left it.
The raster bits are read-only, as they are on real hardware, and the emulation
sits at the bottom of the debugger’s memory layer. Every reader goes through
it: the memory viewer, the monitor, watches and the simulator all show the beam
position at $9004, and no store to that address can change what a read of it
returns.
Step into
Stepping into code will return to the debugger after the next instruction (the one currently highlighted if we have debug information) is executed.
Step over
Step over behaves the same as step into, but if the next
instruction is a subroutine call (JSR), execution continues until the
instruction after the JSR (after the subroutine returns).
Step out
The step out command traces the program until the current subroutine returns (via an RTS instruction). The RTI instruction also returns execution to the debugger.
By default this command will abort if the stack pointer is at its max value (when
another RTS would underflow). Pressing  +
+  overrides this and will allow
the stack pointer to underflow.
overrides this and will allow
the stack pointer to underflow.
Trace
Trace executes the program as a series of STEPs until the user indicates we
should halt the trace by pressing .
The trace command renders the current state of the screen and color memory in addition to the current VIC register values so that you can visually watch your program execute during a trace if it has a visual component.
Free run (go)
The GO command begins execution and returns to the debugger only when a
breakpoint is encountered or when is pressed. Unlike any of the step/trace
commands, Go will not simulate anything. Control is given entirely over
to the user program. This could be dangerous, but is likely necessary in many
cases. A nearly finished game, for example, will require the user to give over
control to the program in order to play that game.
That said, take caution when using this command and expect to lose any unsaved state
Notes on memory swapping
If we aren’t stepping/tracing code (as with the go command) we give full control to the user program. We cannot know what memory will be affected once we hand over control to the user program, so Monster saves the entire debugger state of the internal RAM and restores the entire user state.
Auxiliary views
Within the debugger, there are 3 auxiliary views that may be activated with the function keys. Each shows information about the machine or debug state. Each viewer also contains an editor, which is activated with the keys enumerated below next to their corresponding editor.
Pressing will return the user from the auxiliary editor to the
source code editor; the view stays open below it. To close the active view outright,
press +  while it has focus.
  closes every open view at once to
maximize the source editor’s screen size.
closes every open view at once to
maximize the source editor’s screen size.
Memory viewer
The memory viewer displays the contents of RAM at a given address. The memory viewer is updated upon reentry to the debugger (if active). Memory values may be updated by navigating to the value the user wishes to change and overwriting it with a new hex value. The change occurs immediately.
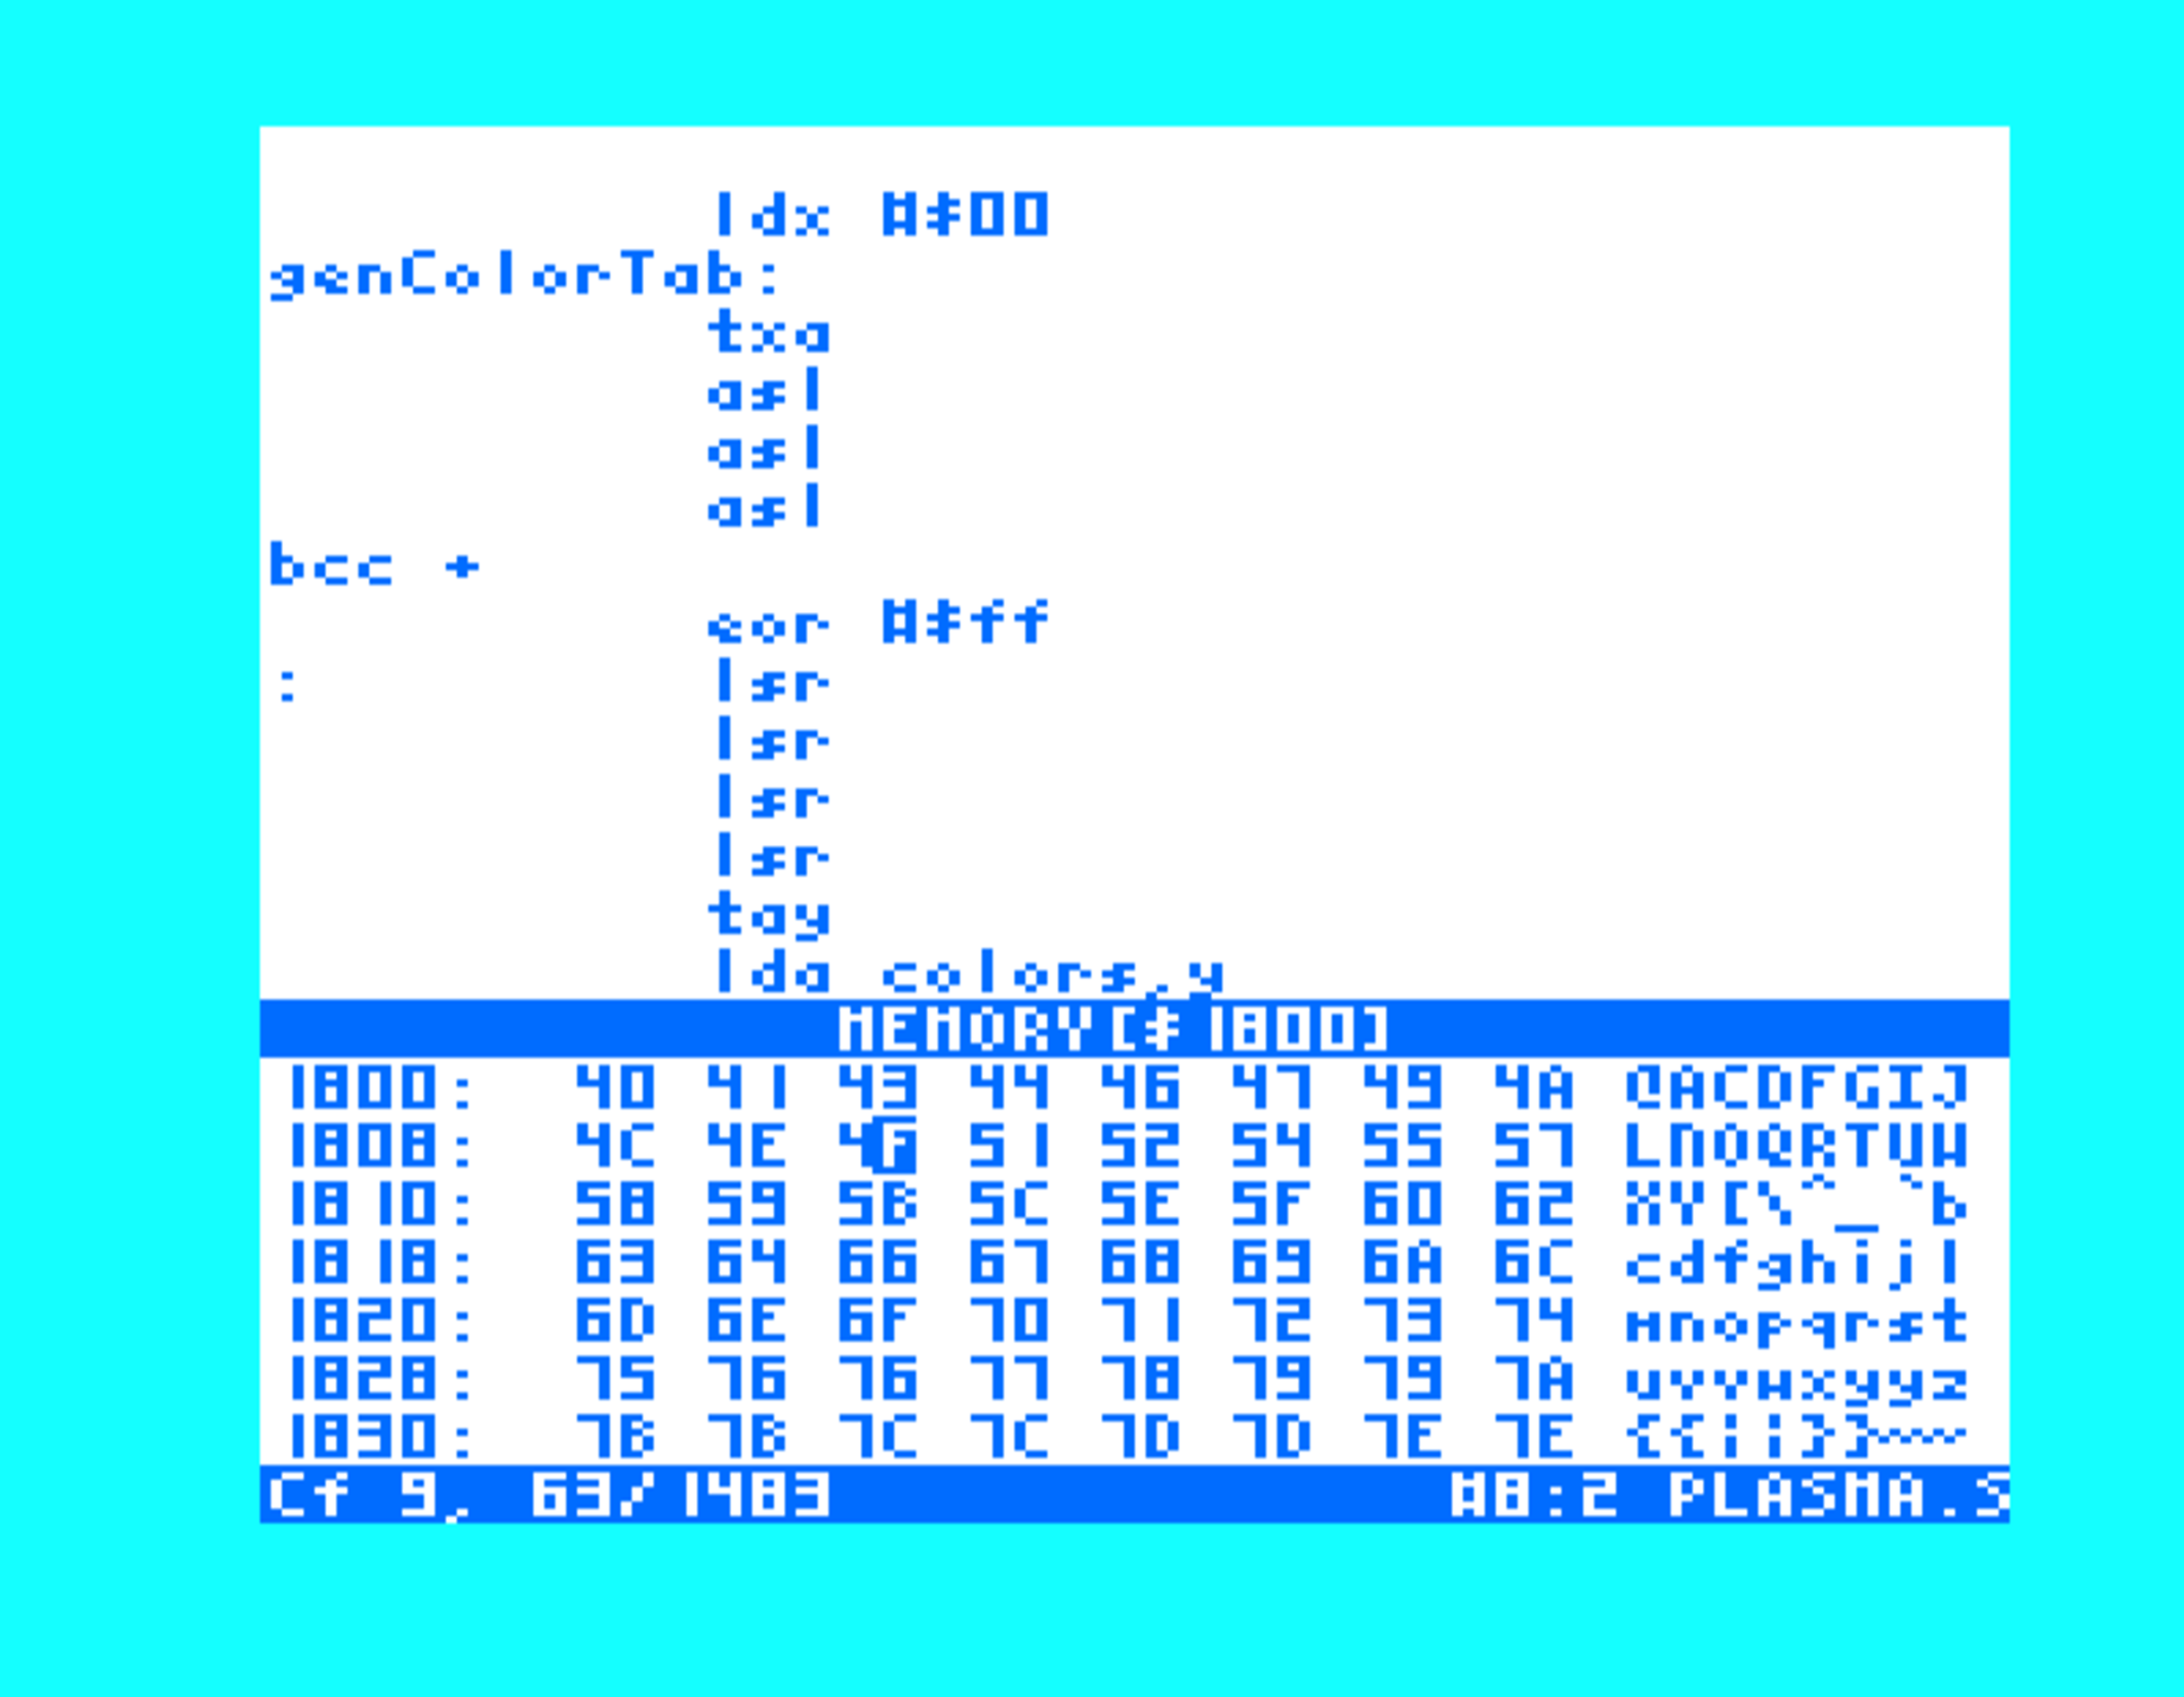
The memory viewer shows hexadecimal values and their character representations
In addition to hexadecimal keys to edit memory values, the following commands are supported within the memory viewer:
SHORTCUT |
NAME |
DESCRIPTION |
|---|---|---|
|
ADD WATCH |
Add watch to the highlighted address |
|
FIND VALUE |
Seeks from current memory address for given value |
|
EXIT |
Returns to the debugger (the view stays open) |
|
CLOSE |
Closes the memory viewer |
|
SET ADDR |
Sets the viewer’s address to the given value; use the dedicated up-arrow key, not cursor up |

Set watch
The SET WATCH command activates a watch at the address of the cursor. The watch created
is a LOAD/STORE watch meaning it will trigger whether the selected byte is written to or
read from. See the Watch Viewer section for more information on watches and how to use
their more advanced functionality.
Find value
Prompts the user for an 8 or 16 bit value (determined by the number of characters provided) and looks for that value in memory. If it is found, the memory view is updated to begin at the first address that was found containing the specified value.
Note that when seeking for a 16 bit value, the value is searched in little-endian
format. If the input for the search is given as $1234 the result will be
the first occurrence of the byte value $34 followed by $12.
Set address
Press the dedicated up-arrow key to move the cursor to the address field, then enter the
new starting address for the memory viewer. Pressing confirms the new address
and cancels and returns the user to the editor without changing the address
Breakpoint viewer
The breakpoint viewer displays all the breakpoints that have been set by the
user. A circle is displayed next to those that are currently active.
The user simply navigates the list with the cursor keys and presses to
toggle those which he/she wishes to enable/disable.
Note that breakpoints correspond to the debug information generated with
the +  command. If the line numbers change after this information is generated,
breakpoints are unlikely to behave in expected ways.
command. If the line numbers change after this information is generated,
breakpoints are unlikely to behave in expected ways.
Watch viewer
The watch viewer displays all watches that have been set in the memory viewer. The current value of a watch is shown along with its previous value (if it has changed since the debugger last took over).
Each row ends with its trigger mode: load for loads, store for stores, or
load/store for both.
A watched address (or range) will also be prefixed with a ‘!’ if it was modified during the trace or step. This is especially important for knowing that a range was modified as ranges do not list the previous or current values for the watch.
The following keys are supported within the watch viewer:
SHORTCUT |
NAME |
DESCRIPTION |
|---|---|---|
|
ADD WATCH |
Prompt the user for expressions to watch |
|
SELECT/EDIT |
Enters the memory editor at the watch’s address |
DEL |
DELETE |
Removes the selected watch |
|
EXIT |
Returns to the debugger (the view stays open) |
|
CLOSE |
Closes the watch viewer |
Add watch
While in the watch editor, ADD WATCH prompts the user for an
address or address range to watch. These are given as expressions, so you may
provide, for example myval+3 to set a watch at the address of the label myval plus 3.
To set a watch for an address range, simply provide two expressions, separated by a comma,
at the prompt. If the expression(s) are invalid, no watch is added.
Edit watch
SELECT/EDIT invokes the memory editor at the location of the watch
that was selected. Returning from the memory editor will return the user
back to the watch editor.
Delete watch
Select the watch and press DEL (the INST/DEL key without SHIFT). In the
monitor, use w to find the watch ID and wr id to remove it. IDs can change
after deletion, so list the watches again before removing another one.
Breakpoints
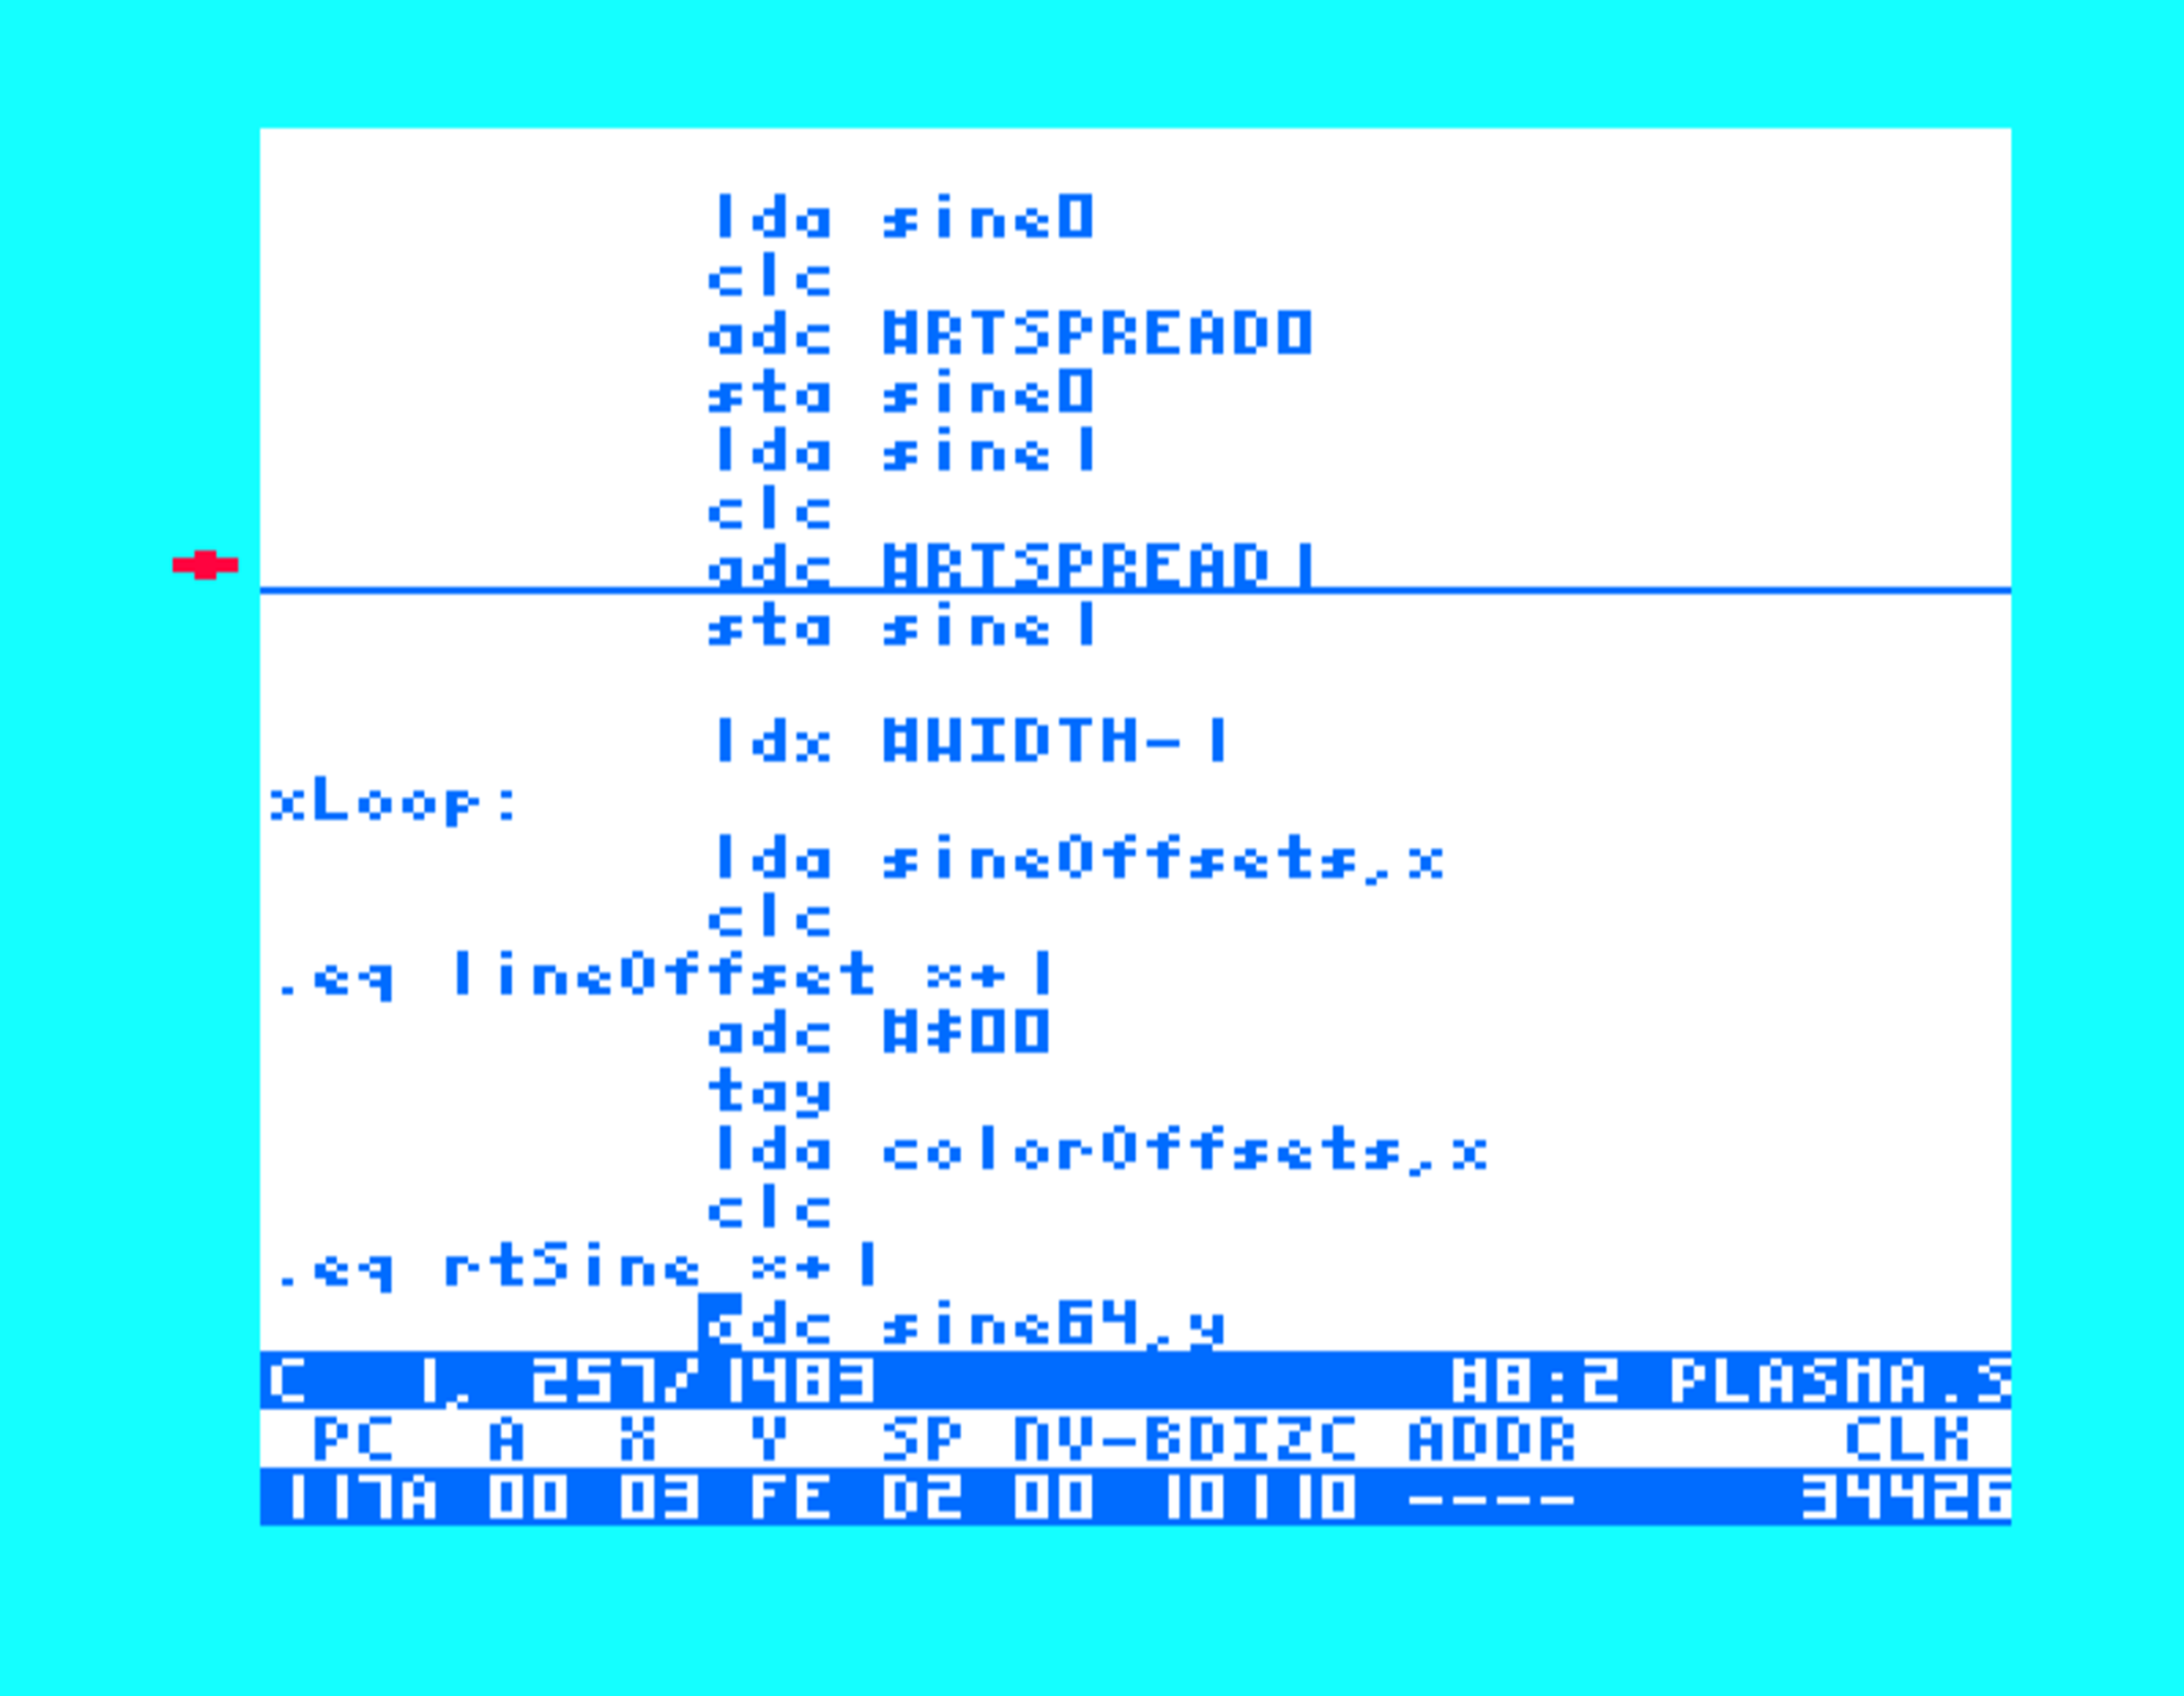
The debugger halted on a breakpoint
Breakpoints may be set/removed during both normal editing and while debugging. Setting a breakpoint inserts a special character into the source buffer, which tells the assembler to generate a breakpoint for the line that this character resides on.
Because the breakpoint is represented as a character within the source code itself, it will automatically move as lines are inserted and deleted. The character itself is not editable (the cursor will not move to breakpoint characters). You may remove it by toggling the breakpoint off or by deleting the entire line.
NOTE: Debug information is only generated for instructions not data. This means
that, for example, you can set a breakpoint on LDA #$00 or a macro that expands
to such an instruction, but setting one on .DB $00 has no effect.
Toggle breakpoint
During normal editing, press +  to set or remove a breakpoint.
Repeating the command on a line that already has a breakpoint will remove it.
NOTE: breakpoints can only be added to buffers that have been named.
Watches
Watches are set within the memory editor. When the cursor is over the
desired byte to watch, then press +  to add a watch to the address of the
byte under the cursor. A beep will confirm that the watch
was added.
to add a watch to the address of the
byte under the cursor. A beep will confirm that the watch
was added.
The watch editor shows all active watches. This window displays the old value of a watch and what it was changed to when it is updated.
When a value is changed the watch view is activated to alert the user to the alteration. If a read or write is detected while stepping into the code, the viewer is also activated.